HueArts NYC Brown Paper
Findings
Survey Data
While we were working with a relatively small survey sample of 41 POC arts entities based on eligible responses, the results were telling. The survey outcomes began to form a consistent picture of organizations providing diverse and extensive programming, creating and presenting artwork outside of the major commercial corridors, and based in the neighborhoods that are the city’s lifeblood. The dearth of consistent funding and revenue has a significant impact on the ability of POC arts and cultural entities to establish themselves as places where artists can build and develop lifelong careers. With limited funds available, POC arts entities often struggle to pay artists and administrators on par with what they would receive from larger, well-funded, predominantly white arts organizations.
Below are some of the detailed quantitative survey findings that built our understanding of arts entities founded and led by Black, Latinx, Indigenous, Asian, Pacific Islander, Middle Eastern, and all People of Color.
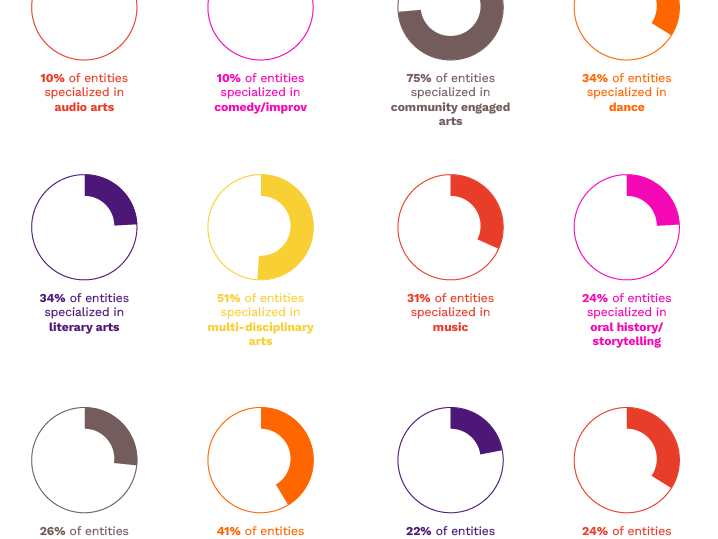
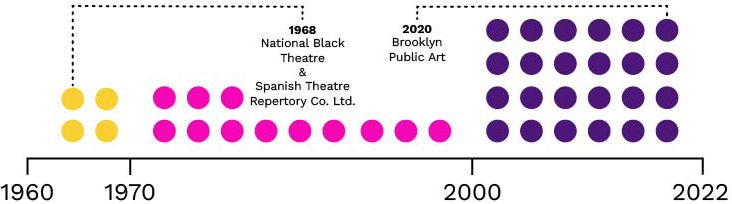
Age & Self Description
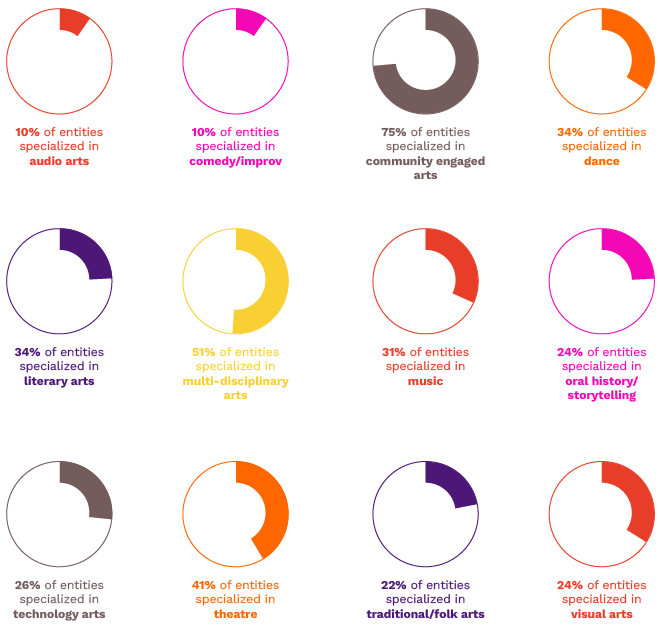
Most organizations that participated in the survey—58% of the 41 arts entities surveyed—were founded in 2000 or later. Just 10% of the responding entities were founded before 1970, while 32% were founded between 1970 and 1999. Notably—and reinforcing findings from interviews and from the mapping project—76% of organizations described themselves as community-engaged arts organizations. Approximately half of the surveyed entities included multidisciplinary and visual arts as descriptors.
Type of Entity
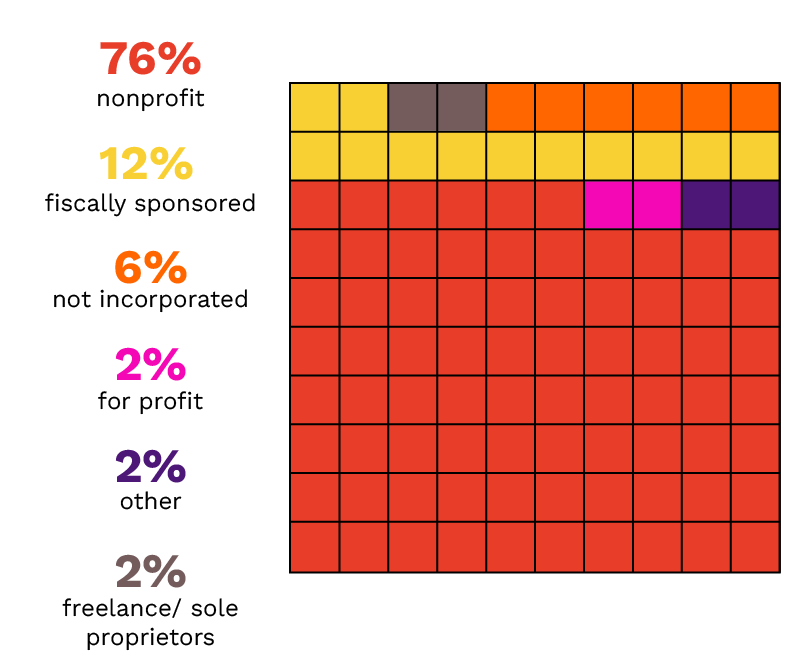
Our criteria for the type of business structure required for inclusion in this project was intentionally broad in an effort to capture those arts entities operating outside of the formal nonprofit sector. However, given that project outreach was driven primarily by nonprofit arts organizations, 76% of arts entities that participated in the survey were not-for-profit organizations, and 12% were fiscally sponsored. The 23% of participants operating “outside the [grant] system” presents an opportunity to further explore how these POC arts entities find alternative approaches to supporting, presenting, and producing art.
Space
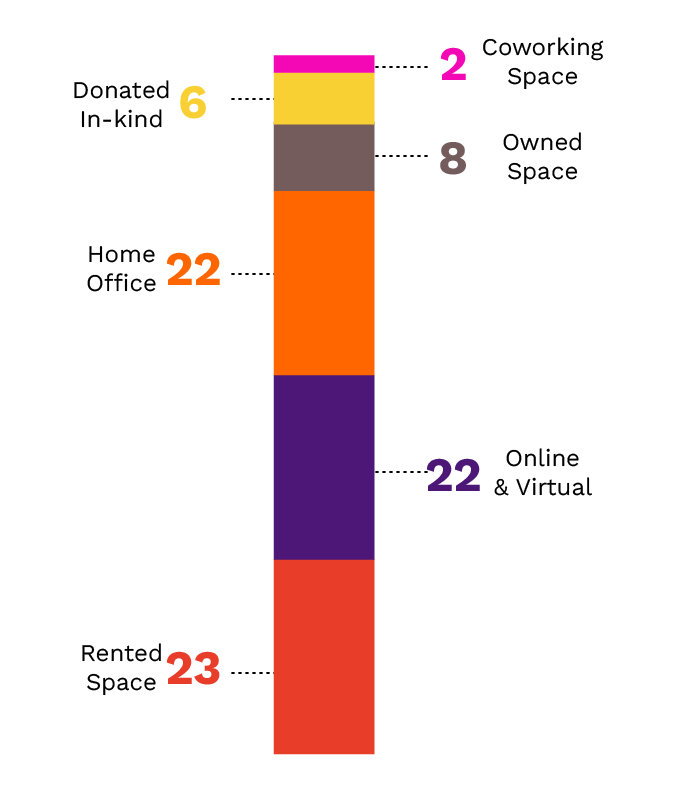
A third of 41 surveyed entities work in rented space, a third reported working in a virtual-only environment, and a third said they operated out of a home office. Just eight organizations said they owned the space in which they operated. It is important to reiterate here that POC arts entities have historically had far less access to city-owned property, compared with predominantly white arts organizations, and this has negatively impacted their ability to establish stable permanent homes for their arts and programming.
Community Programming, Neighborhoods & Languages
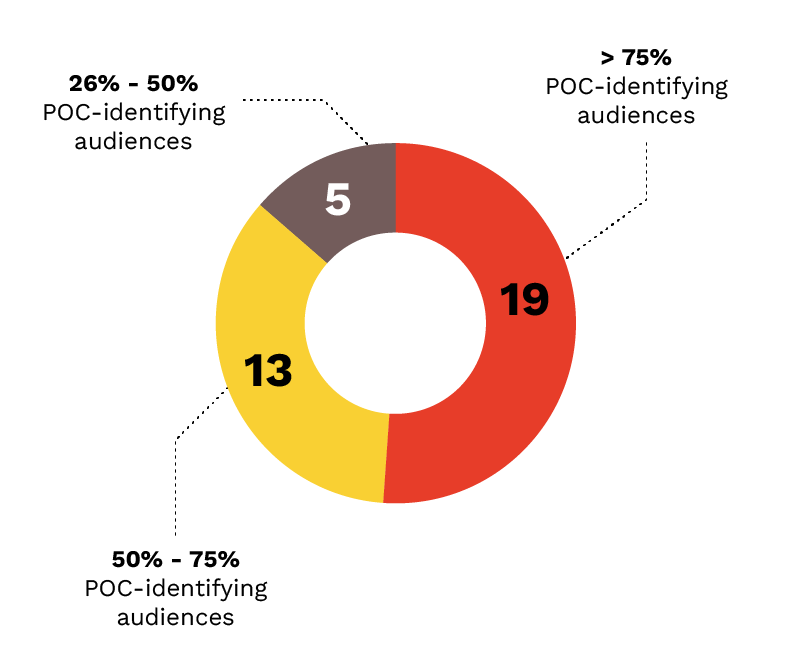
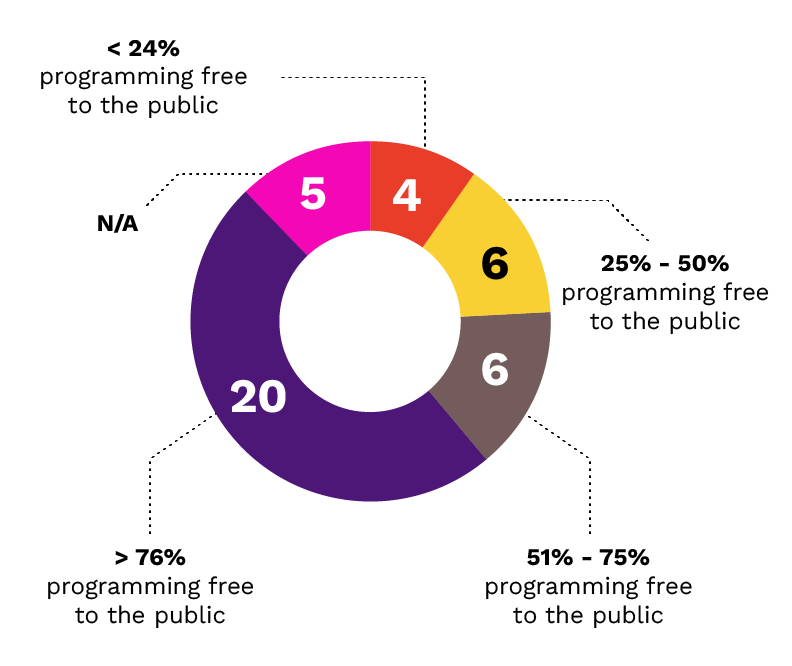
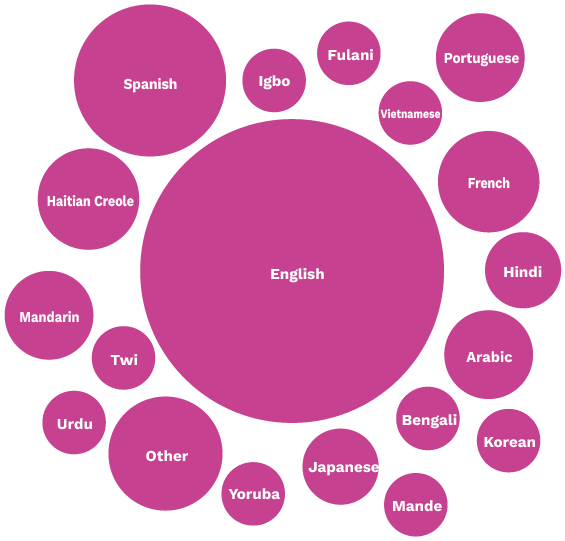
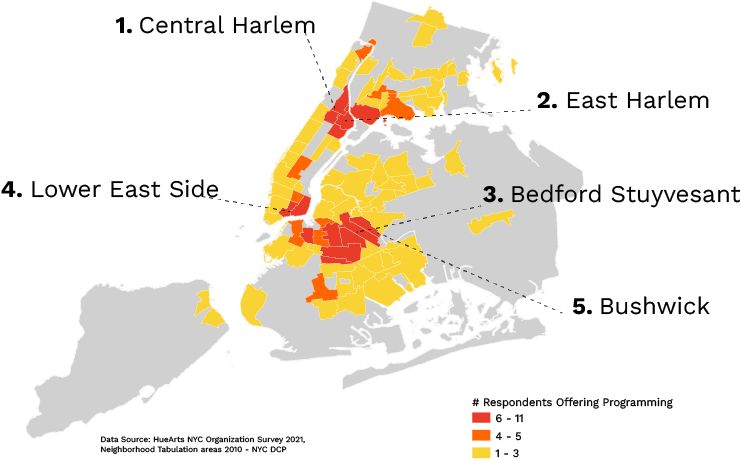
The arts entities surveyed produce community-relevant programming such as creative workshops, festivals, dance classes, and more. When asked about the percentage of their audiences, customers, and/or participants, more than half of the respondents reported between 75% and 100% People of Color. Also, nearly half of the surveyed entities claimed that more than 75% of their programming was offered free to the public. The respondents produced programming in 17 languages in addition to English, including Spanish, Haitian Creole, French, Mandarin, Arabic, Japanese, Hindi, Igbo, Twi, and Fulani. We also asked respondents in which borough of New York City most of their programs take place (organizations could select multiple neighborhoods in each borough).
Most programs are offered in neighborhoods such as East Harlem, Central Harlem, or the Lower East Side in Manhattan; and in Bedford-Stuyvesant, Bushwick, or Crown Heights in Brooklyn; followed by a significant but far smaller number of programs in neighborhoods such as Mott Haven in the Bronx.
Budget and Funding
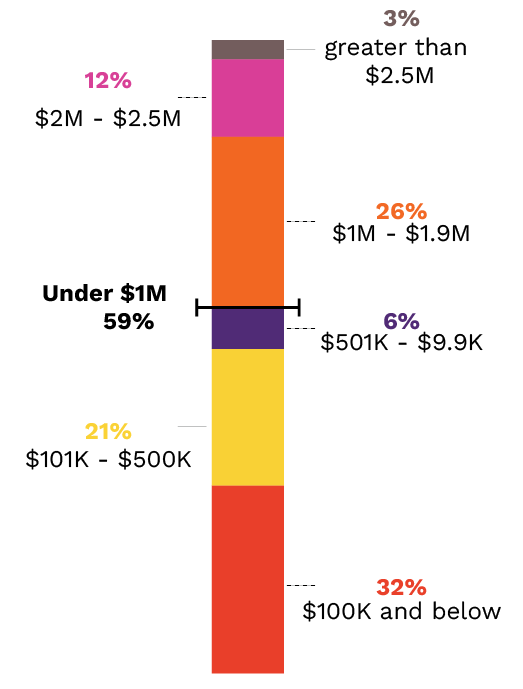
The biggest source of income for responding arts entities comes from government and/or foundation grants. This was followed by earned income, and then individual donations. Among those that identified foundation and/or government grants as their top source of income, nearly half stated this income constituted more than 50% of their total budget. While only 83% of survey respondents provided their annual budget data, nearly 60% of respondents reported an annual operating budget under $1 million, the majority of which have budgets under $500K. Approximately 26% reported a budget between $1 million and $2 million. 12% reported an annual operating budget in the $2 million to $2.5 million range, and one CIG organization, Museo del Barrio, reported a budget of $6.5 million.
Funding Challenges
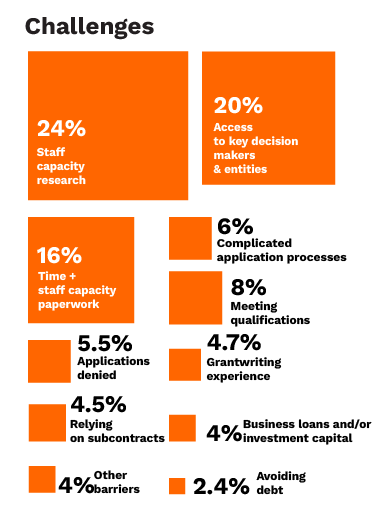
When asked what typically bars them from accessing funding/capital investment, 73% of organizations cited limited staff capacity to devote necessary research and cultivation efforts to building individual donor support. The second most commonly selected option was a lack of access to key decision-makers. The most pressing challenges regarding funding, which were reiterated in comments made in interviews and community conversations, revolved around inadequate staffing and/or bandwidth to navigate the grant-funding process and lack of connections to decision-makers that make those processes more accessible.
Current Organizational Need
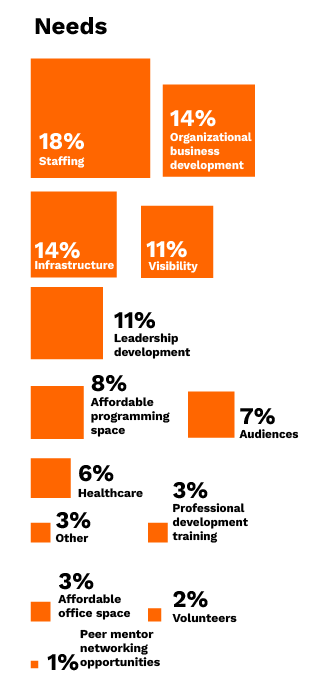
Figure 11: Organizational Needs aside from Funding
When asked to identify their biggest needs aside from funding, surveyed entities doubled down on the issue of lack of staffing, business-development resources, and infrastructure. Of the 30 entities that completed this survey question, 28 reported having one or more paid staff, and nearly 68% employ the same number or more of part-time staff as full-time staff. What has become clear in this initial inquiry is the need for more nuanced data in the arena of staff composition, compensation, development, and retention to better understand and analyze the capacity issues raised by our surveyed POC arts entities.
“Our ability to always figure out ways to survive and lift up each other is our strength. Our ability to overcome.”
—Jordyn Jay, Black Trans Femmes in the Arts